
The weather is in the news, that's for sure. Whether it be generalized thoughts about seasonal heat or cold, the UN's Right to Health Declaration this week. Regardless of perspectives, weather's effect on human health is a reality (just ask anyone without summer air conditioning or winter heating). In this vein, our data scientists wondered: We know these trends have been observed in previous research and are commonly reported in the news, but we wanted to see if we could observe the same trends for our care population...
Methods
We began by reviewing the International Classification for Disease (ICD) diagnoses related to heat, which produced the following diagnosis codes:
The ICD-10-CM codes include:
- T67.0-, heatstroke and sunstroke
- T67.1-, heat syncope
- T67.2-, heat cramp
- T67.3-, heat exhaustion, anhydrotic
- T67.4-, heat exhaustion due to salt depletion
- T67.5-, heat exhaustion, unspecified
- T67.6-, heat fatigue, transient
- T67.7-, heat edema
- T67.8-, other effects of heat and light
- T67.9-, effect of heat and light, unspecified
We also pulled the corresponding ICD-9-CM codes to confirm no patients were missed.
Our next step was to collect 2018 weather data to supplement the Electronic Health Data from the Translational Data Warehouse (TDW). Through Climate.gov, we obtained Forsyth County’s historic weather data for a 12-month period. We then compared the maximum temperatures from the weather dataset to the number of cases of heat and light related illnesses that were recorded in the EHR.
Findings
Cases by Week with Monthly Correlation
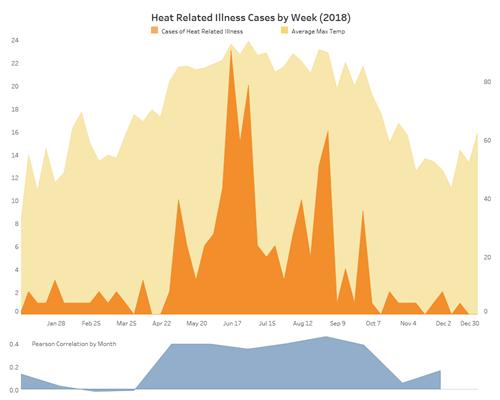
The visual output of TDW data quickly showed us correlation between summer months and heat related illnesses, allowing quick confirmation of our hypothesis. When counting the number of patients diagnosed/day, we used a distinct count to only include each patient once per day (and avoid including the duplicates that had both ICD 9 and ICD 10 codes recorded for the same encounter).
For this plot, we used a weekly average of maximum temp and count of diagnoses to try to reduce some of the noise and help us better observe trends. Monthly correlation was included below to help us visualize the difference in the relationship of the maximum daily temp and the daily count of diagnoses in the winter vs summer months. It did show stronger positive correlations in the summer months (as temp increases, so does the number of cases of heat-related illnesses) than in the winter months.
Past studies have found that single days with elevated temperatures have less impact than heat waves (defined as at least three consecutive days with temperatures between 35°C and 37°C, or 95-98.6°F). Forsyth County did not experience any qualifying events during the 2018 calendar year, so we were not able to identify any increases in the number of heat and light related illnesses that could be attributable to a heat wave. Incidentally, there were very few days with temperatures higher than 90°F (26 days in total)—the case trends that we do see may have more to do with the combination of heat and humidity (heat index) than heat alone. As suggested in this article, the effects cannot be readily observed until the heat index reaches at least 100°F.
2018 Graph Broken Out by Diagnosis

After observing that there were still a fair number of cases in the winter months, we wanted to explore potential reasons why. In order to better understand the trend that we were observing, we wanted to break down the number of cases by the individual diagnoses. This visualization does not include the diagnoses that had very little contribution (T67.3-, heat exhaustion, anhidrotic; T67.6-, heat fatigue, transient; T67.8-, other effects of heat and light; which accounted for only 4 cases), or the diagnoses that had no contribution (T67.2-, heat cramp; T67.4-, heat exhaustion due to salt depletion; T67.7-, heat edema).
Heat syncope is the only diagnosis that appeared regularly throughout the year. According to this description from Princeton, it is a milder form of heat illness which is probably why we are able to observe it more easily, even in milder temperatures. (That same article also shows what relative humidity can do to the heat index.)
Considerations
The Translational Data Warehouse allows us to compare existing EHR to other datasets to depths we are only just beginning to mine. We typically experience a milder climate (less high temps) than places like Atlanta, GA (an area that several previous research studies investigated), so it is not all that surprising that the effects of heat were less observable for our care population. We also had very few cases of heat and light related illnesses last year (only 210 distinct patients were treated for heat and light-related illness during the entire year); and it is difficult to observe trends or make meaningful inferences for a sample of that size.
What knowledge is hiding in your data?
Every week we are increasing the wealth of data available through the i2b2 self-service data puller. Our team is excited for where we are heading, and we want to know: what knowledge is hiding in your data?
Reach out today for more information on conducting your own i2b2 queries, or to request a data pull from the Translational Data Warehouse.
For more information submit a CTSI Service Request
or contact Informatics Program Director Brian Ostasiewski.