
We know the feeling. You open the fresh export of data, ready to dive in and extract the knowledge hidden in these columns and rows…and you’re hit with a wall of numbers. It can be a little overwhelming.
Here at CTSI, we’re piloting something we think might help: For every i2b2 Data export file we’re going to include a Summary Statistics Report. The intent? To process your data into easy-to-understand descriptive statistics that may inform and improve the way you begin cracking into your data.
Want a taste of what this report will look like?
We thought you might!
Generated with R and sent as an HTML file, the report will allow you to navigate to a friendly, clickable index listing the general descriptive summary of each domain (or sheet).
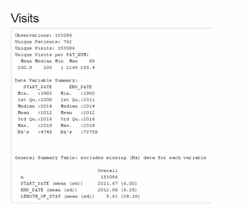
Each domain summary has some uniform information. E.g., each section starts with summary data regarding the number of observations and date ranges as well as a generic table of all numeric and categorical variables with fewer than 10 categories. Take the Visits domain as an example below:
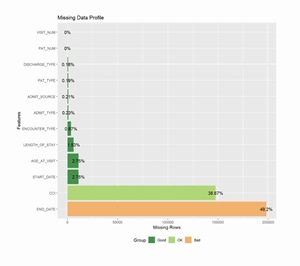
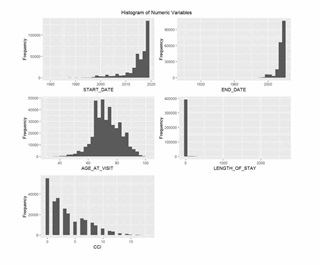
Each domain also has a missing data profile per variable (column) in bar and histogram formats of all numeric variables. Please keep in mind: this is all raw data. It’s not been cleaned nor scrubbed for accuracy, but it can facilitate your initial plunge into the data and the discovery of outliers and unexpected results.
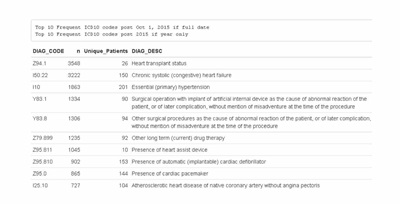
Next, you’ll see breakdowns of the top 10 codes reported for Procedures, Diagnoses, Medications, and Smoking Status sheets. Diagnosis codes are reported by frequency and by year of of ICD-10 implementation:
Curious at an initial brush at lab code data? The Labs summary takes the top 10 most frequent numeric lab codes and summarizes counts, measures of central tendency, and reports all respective descriptions and units associated with that code. Cool, right?

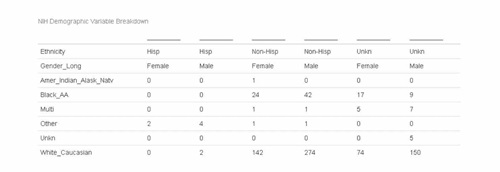
A particularly useful feature we’re excited about: if the Patient sheet contains demographic variables, a report resembling the NIH population table is generated. This can be helpful for cohort feasibility and grant submissions!
Explore an example of a full Summary Report!
Click here to download the html file.
Interested in seeing what the data says about your study?
Reach out today for more information on conducting your own i2b2 queries, or to request a data pull from the Translational Data Warehouse.
For more information submit a CTSI Service Request.
or contact Informatics Program Director Brian Ostasiewski.