
Living in an economically disadvantaged area has been linked to a number of negative healthcare outcomes and to greater utilization of healthcare services. The Area Deprivation Index (ADI) measures how socioeconomically deprived residents of a specific area are on average. It includes information on the average area measures of income, education, employment, and housing quality. This information can be used as a patient-level proxy measure for socioeconomic status to better inform research.
You can now access both national and state level ADI data through i2b2.
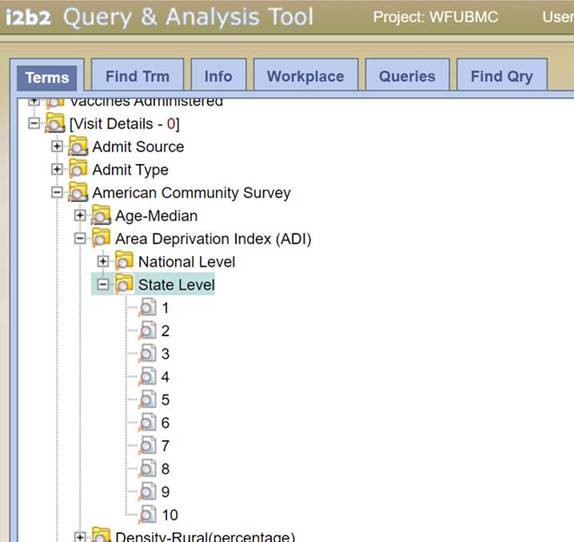
Navigate to Terms> Visit Details> American Community Survey> Area Deprivation Index (ADI). From there you can select national or state.
The ADI scores are percentile rankings at the block group level. The national ADI percentiles go from 1 to 100 with 1 being the lowest ADI (i.e. the lowest level of disadvantage) and 100 being the highest ADI (highest level of disadvantage). The North Carolina state ADI is in deciles from 1 to 10 and is not in relation to the national ADI. Similar to the national ADI, the state ADI group 1 has the lowest ADI (lowest level of disadvantage) and 10 is the highest ADI (highest level of disadvantage).